OncoPROSTATE Dx – Prostate Cancer Diagnosis Test
Overview
OncoPROSTATE Dx is an innovative, non-invasive, accurate, and cost-effective already validated test to help in Prostate Cancer diagnosis as well as confirmatory diagnostic ―as an adjunct to suspicious image procedures findings, in order to reduce the number of unnecessary tissue biopsies that patients have to undergo―, with potentially uses for screening, prognosis and recurrence monitoring.
OncoPROSTATE Dx is based on a score calculation that it is obtained from several Biomarkers of the patient (mainly Tumor Markers but also patient’s clinical information).

Click here to download the brochure in PDF format.
Tumor Markers
Tumor Markers are parameters released by tumor cells, which enter the bloodstream or other biological fluids and are useful for the diagnosis, prognosis and treatment monitoring.
Most Tumor Markers are not specific to any type of cancer and the differences between benign and malignant diseases are quantitative (for example, patients with epithelial tumors tend to have significantly higher levels of these Tumor Markers than patients without malignancy).
There are now more than 20 well known parameters that are widely regarded as Tumor Markers such as PSA ―related to Prostate Cancer―, CA 15.3 ―related to Breast Cancer―, CA 125 and HE4 ―both related to Ovarian Cancer―, CEA and CA 19.9 ―both related to different gastrointestinal cancers (Colorectal, Gastric and Pancreatic Cancer)―, or NSE and ProGRP ―both related to in Lung Cancer―.
However, there are a variety of factors that can affect the accuracy of Tumor Markers by increasing its levels without malignancy presence. The main reason are benign diseases, among others, such as technical interferences.
In this sense, the Spanish Society of Clinical Biochemistry and Molecular Pathology, Cancer Biomarker Commission established the Barcelona Criteria, 4 criteria that help to correctly distinguish and value Tumor Markers results and reduce False Positives (FP):
- Tumor Markers Serum concentrations.
- Discard benign pathology by the exclusion of main source False Positive results.
- Follow-up if Tumor Markers moderate results (Grey Zone/Undetermined).
- Technical interference.
Statistical measurements in diagnostic tests
Unfortunately, the use of Tumor Markers in routine presents also other problems such as low Sensitivity in early stages, or nonexistence of any specific Tumor Marker for each malignant tumor. However, the combination of 2 or more Tumor Markers has a better outcome, especially in advanced stages.
In this regard, the combination of several Tumor Markers ―as well as the inclusion of patient history information in the equations―, using complex algorithms with multiple variables, results in higher Sensitivity and Specificity: that is what we have christened Multi-Biomarker Disease Activity Algorithm (MBDAA).
The Sensitivity of a diagnostic test is the percentage of actual positives that are correctly identified, and Specificity is the proportion of true negatives that are correctly classified. Both variables are closely linked together and give an idea of the accuracy of a test.
A test that correctly identifies all true positive as positive, but has many false negatives would have a Sensitivity of 100%, but low Specificity. For example, Sensitivity measures the number of cancerous tumors that are correctly identified as cancerous, whereas Specificity measures how many benign tumors are correctly identified as benign. A high Sensitivity means fewer cancers diagnosed as benign and high Specificity means fewer benign tumors diagnosed as cancerous.
Besides, the positive predictive value (PPV) is the number of true positives correctly identified on total real positive. A test with many false positives will have a low VPP. Moreover, the negative predictive value (NPV) is the number of true negatives correctly identified on the total actual negative. A high NPV value means that very few true positives were incorrectly identified as negative.
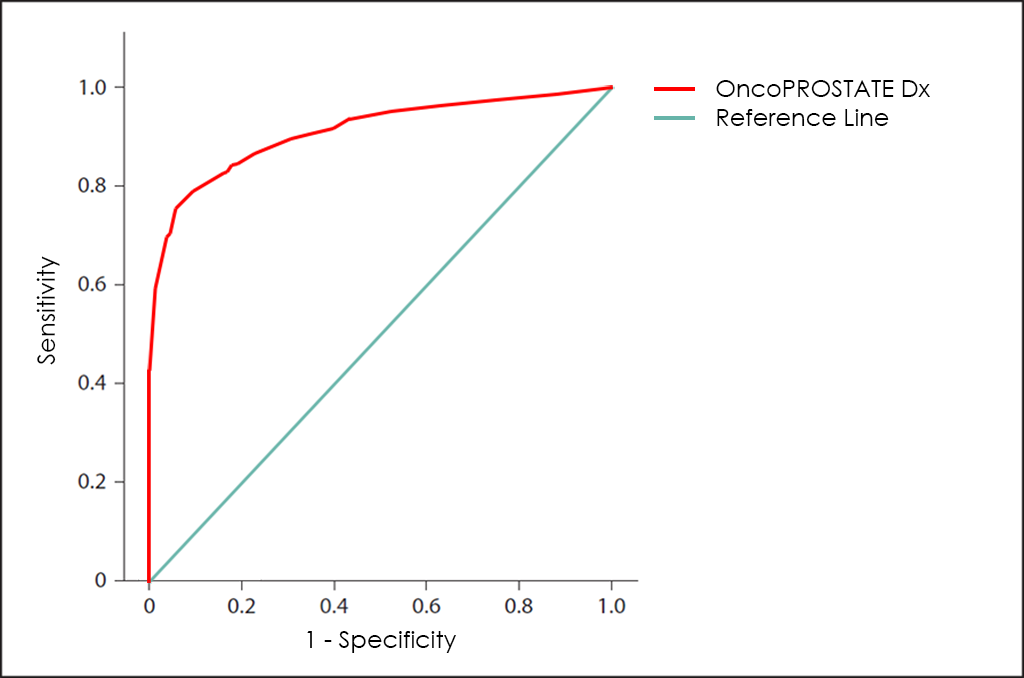
All these different values can be plotted together in a graphic that it is known as Receiving Operator Curve (ROC), where better results are displayed with curves that tends to come near to the upper left corner of the image (where 100% Sensitivity and 100% Specificity are reached).
Receiving Operator Curves (ROC)
The ROC curve of OncoPROSTATE Dx test ―based on the combined count of Total PSA, Free PSA (fPSA), p2PSA and hK2 Tumor Markers; over expression of Post-DRE PCA3 and T2:ERG genes; comorbidities; and other patient’s data from 3.725 patients―, throws a really interesting diagnostic capabilities: 81.7% Sensitivity and 98.2% Specificity.
How does it work
As all BIOPROGNOS’ MBDAA tests, OncoPROSTATE Dx test is available online once access is granted through our secure Cloud Platform. As a Cloud solution, it is designed to be used in a Software as a Service (SaaS) basis, that means, no installation, no periodically patch upgrades, low TCO (Total Cost of Ownership) and no maintenance.
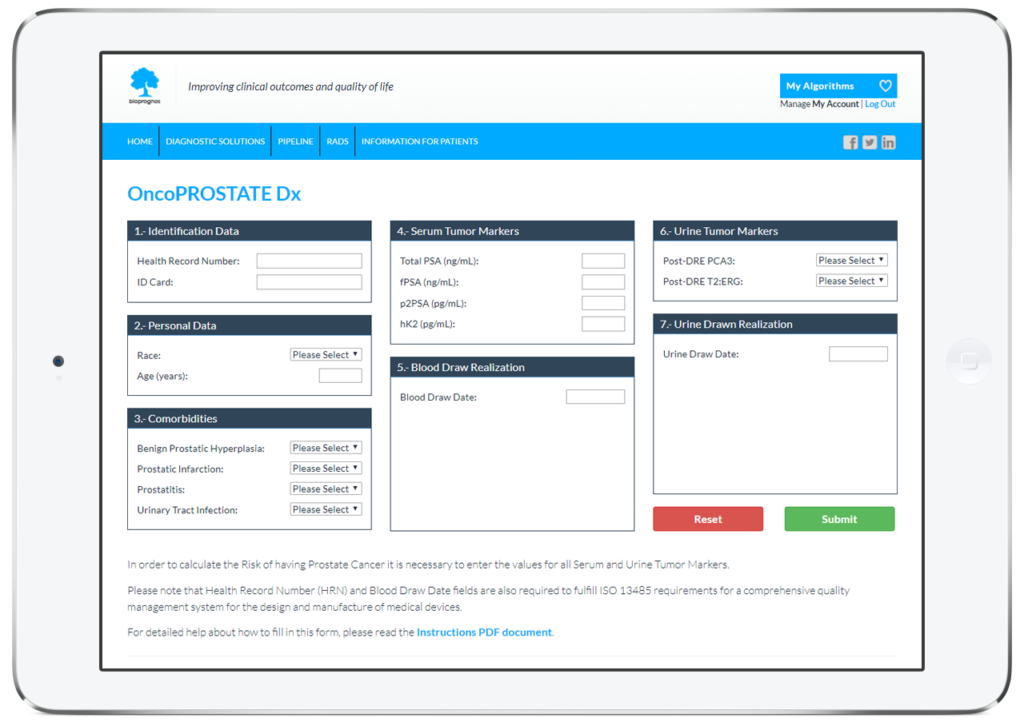
In this way, doctors or lab technicians only should fill the form with values obtained previously from patients (Personal data, Comorbidities and Serum and Urine Tumor Marker values), and click on Submit button in order to obtain the risk score of having Prostate Cancer.
Order Form
To facilitate work, doctors can download and fill the Order Form for OncoPROSTATE Dx in a quick and an easy way ―with all required data for a best risk calculation already detailed―.
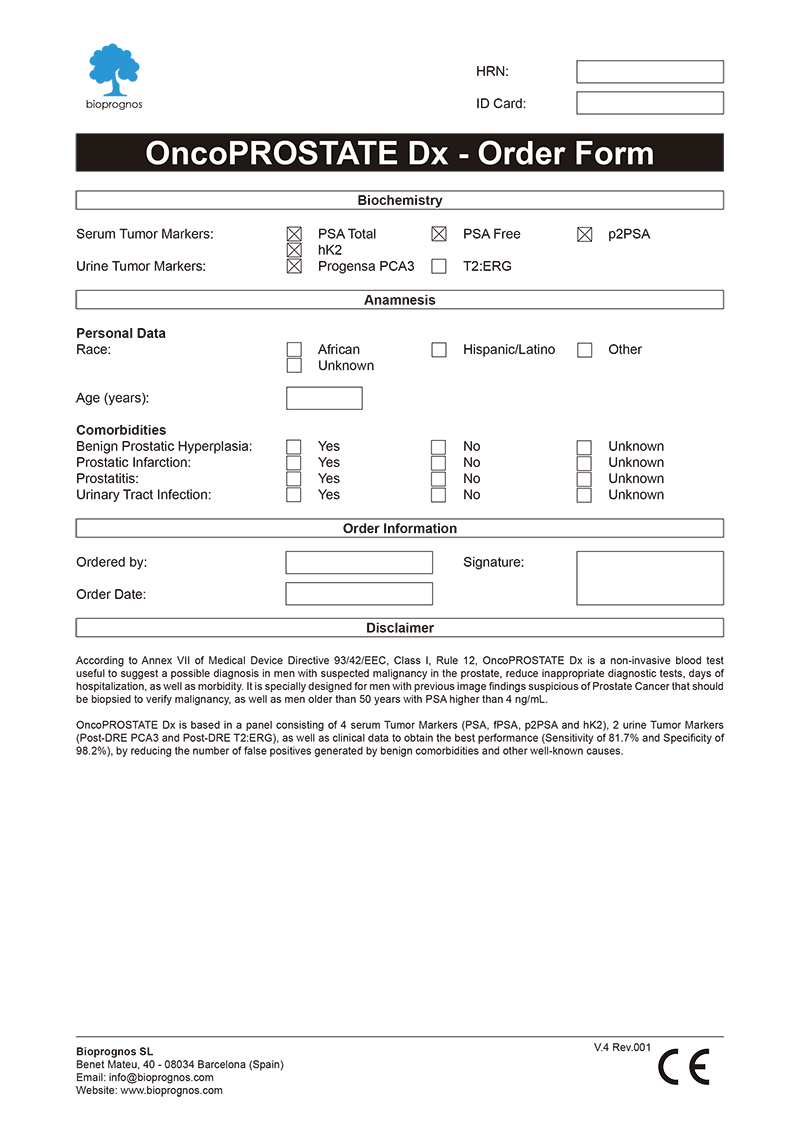
Click here to download the OncoPROSTATE Dx Order Form in PDF format.
Final Report
After doctors entered the patient’s data, OncoPROSTATE Dx test presents the results in a separate screen that can be converted to a PDF document in order to be downloaded or sent by email.
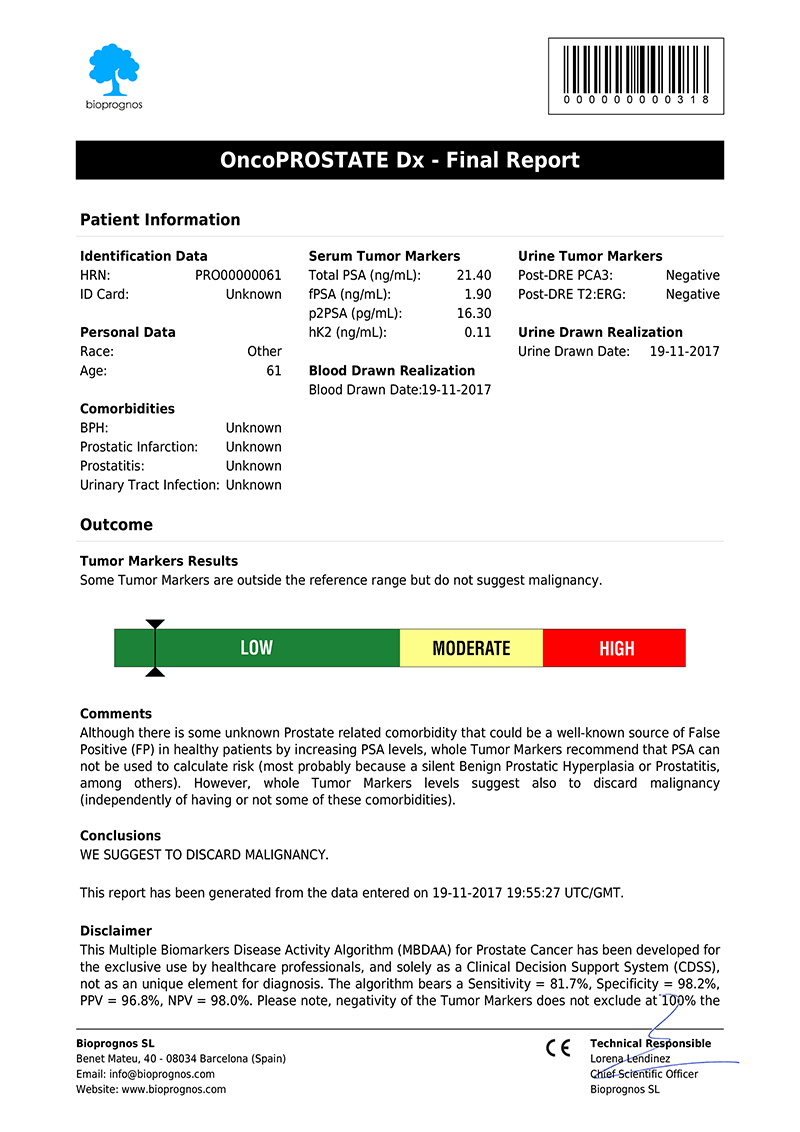

Click here to download the report in PDF format.
The report includes two main sections: Patient Information and Outcome. In the first one, all patient data entered previously is showed as record. The second one includes: Results, indicating whether Tumor Marker levels are within normal range or not; Risk, with a score bar showing the probability of having Prostate Cancer; Comments, that are created dynamically to help doctors and healthcare professionals to understand ―in an easy way―, how to detect False Positives (FP), such as levels of Tumor Markers that would suspect the presence of Cancer, but when considering other variables together ―Race, Age and Comorbidities information―, do not correspond with malignant diseases; and finally, Conclusions, with recommendations suggesting to retest patient in 1 year (for Low Risk), or in 4 weeks (for Moderate Risk, that is, these cases in which Tumor Marker levels are higher than normality but there is not quite clear to be High Risk.
Please note that final report is oriented to healthcare professionals only ―not to patients―, because it was designed as “a tool to help healthcare professionals in Prostate Cancer diagnostic”, and in this way it is been certified by obtaining the CE DECLARATION OF CONFORMITY (Medical Device Directive 93/42/EEC, Class I, rule 12).
CE Declaration of Conformity
Since April 20th, 2017 (when version 1.0 was released), OncoPROSTATE Dx test has the CE Declaration of Conformity that certifies it has been assessed to meet high safety, health, and environmental protection requirements.
Click here to download the OncoPROSTATE Dx CE DECLARATION OF CONFORMITY in PDF format.
This declaration also certifies that OncoPROSTATE Dx test can be sold throughout the European Economic Area (EEA) without restrictions.
Besides, there are two main benefits CE marking brings to businesses and consumers within the EEA:
- Businesses know that products bearing the CE marking can be traded in the EEA.
- Consumers enjoy the same level of health, safety, and environmental protection throughout the entire EEA.
Other tests in the market
Different methods for early diagnosis have been developed, including the use of the PSA Tumor Marker, but the results are not satisfactory, since this marker has a low Sensitivity in the early stages while offering a high proportion of false positives (FP) in all aged men.
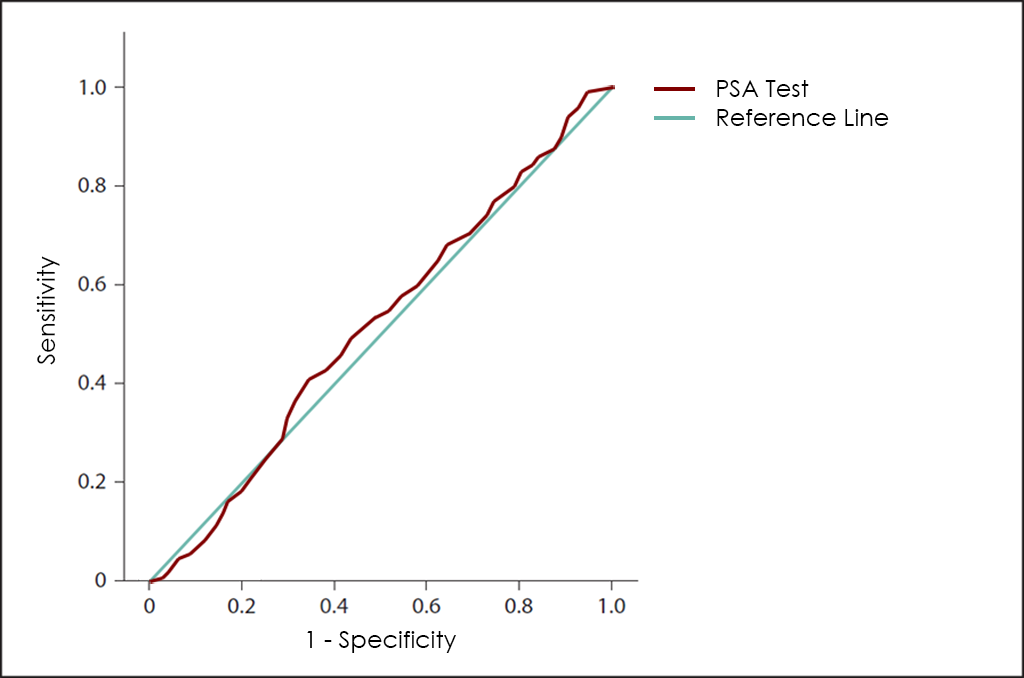
PSA has well-defined roles in prostate cancer including diagnosis, staging, planning of and response to treatment. However, clinicians must remember that PSA is organ rather than tumour-specific.
Further, age-adjusted levels of PSA and free/total ratios only help guide clinicians and still require investigation. For example, the role of free/total PSA (carcinoma has more PSA bound) in the setting of a raised PSA may only prevent biopsies being done once one is satisfied that there is no carcinoma. Also, performing a digital rectal exam at a different time to the PSA test may be advisable to avoid a falsely elevated result.
As more patients request and clinicians order measurement of serum PSA, results outside the normal range (0–4 ng/mL) will increasingly be found. Clinicians must place a raised PSA in context, or there is a danger of creating anxiety and assuming cancer is the diagnosis. This has often occurred where PSA levels are just above normal, but is probably important in the context of any level. The absolute cut-off point used to determine the need to evaluate a patient for prostate cancer by biopsy is not clear and detection rates for a PSA level between 2.5–4.0 ng/mL have been found to be similar (around 30%) to those for the PSA range of 4.0–10.0 ng/mL. This indicates that 2–2.5 ng/mL may be a more appropriate cut-off point than 4.0 ng/mL. Against this, some have suggested that serum PSA may be more related to Benign Prostatic Hyperplasia (BPH) than cancer in the modern era and that there is an urgent need for serum markers that more accurately reflect malignancy.
In recent years, the valuation levels of other novel Tumor Markers, basically PSA isoforms such as p2PSA or Intact PSA (iPSA), offers greater sensitivity for these early stages, and greater specificity, but still not quite good.
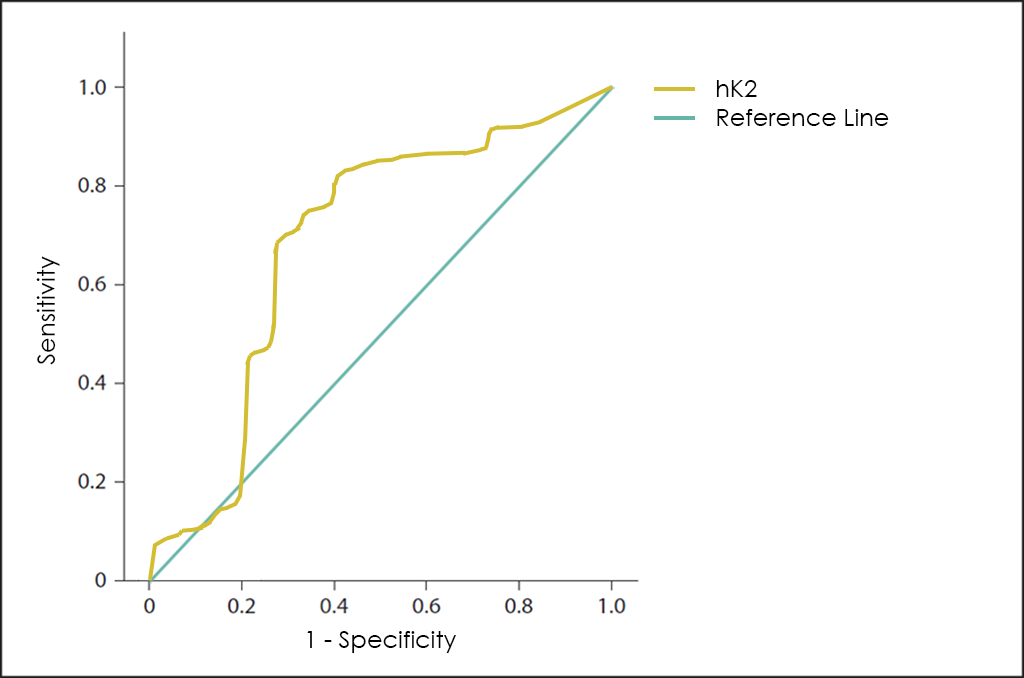
Another interesting Tumor Marker is hK2, which although it belongs to the same family of serum proteases that PSA ―sharing up to 80% of its amino acid sequences―, it seems to differentiate such better between benignity (Benign Prostatic Hyperplasia or Prostatitis, among others) and malignancy than the PSA itself.
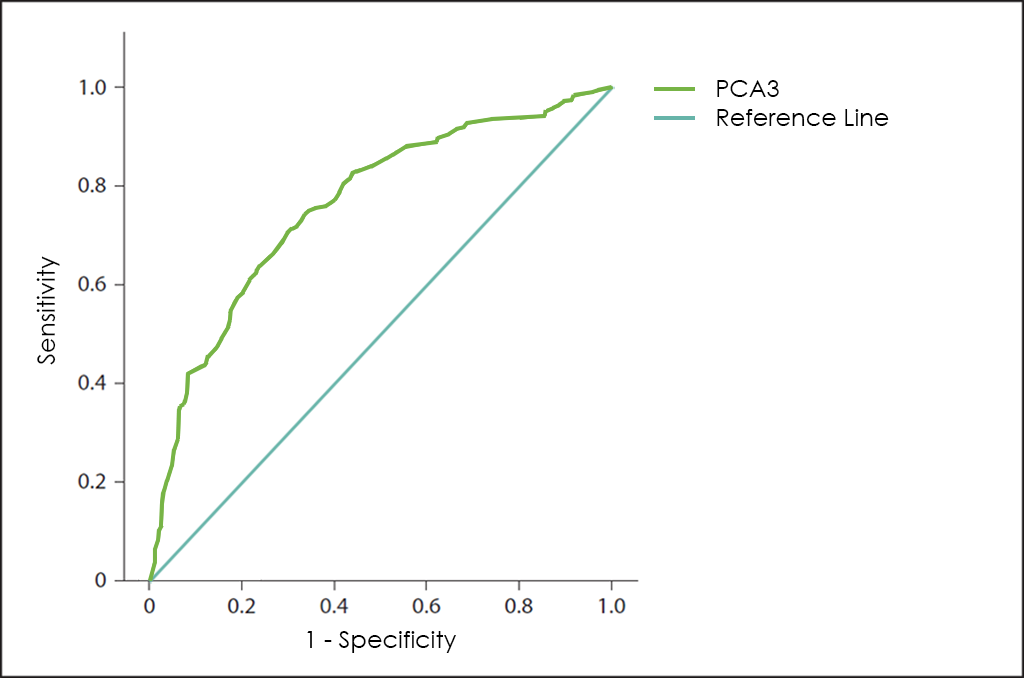
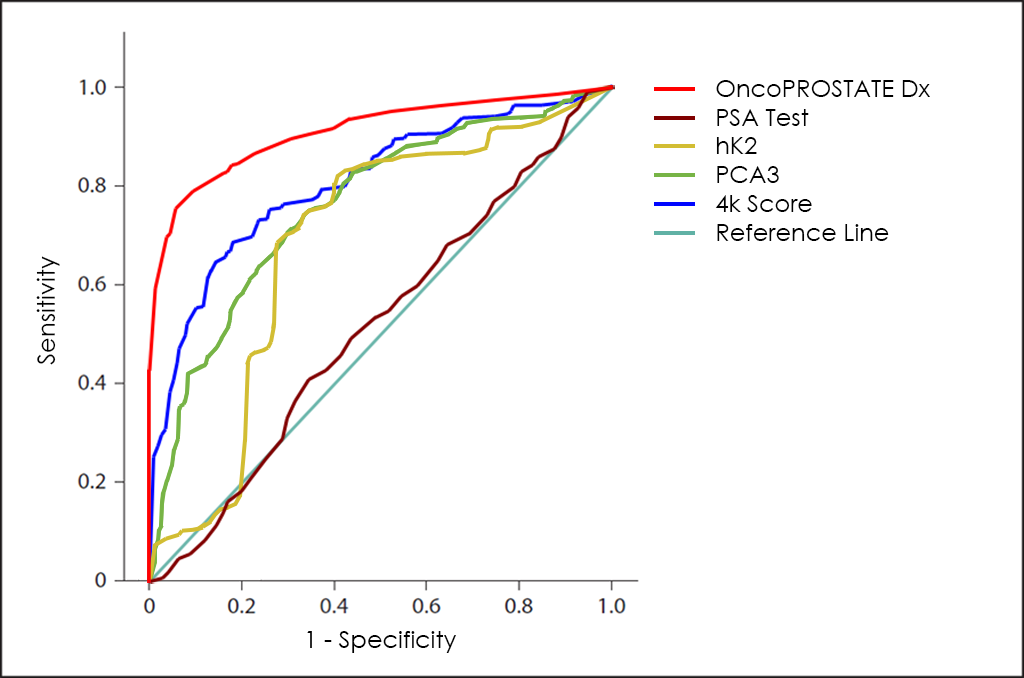
Besides, the Prostate Cancer Antigen 3 (PCA3) is a gene that expresses a non-coding RNA that it is only expressed in human prostate tissue, and highly overexpressed in Prostate Cancer (up to 60 or 100 times in Prostate Cancer cells than in normal prostate cells), so because of its restricted expression profile, the PCA3 RNA is useful as a Tumor Marker, but unfortunately, used independently ―as shows its stand alone curve―, does not have enough performance.
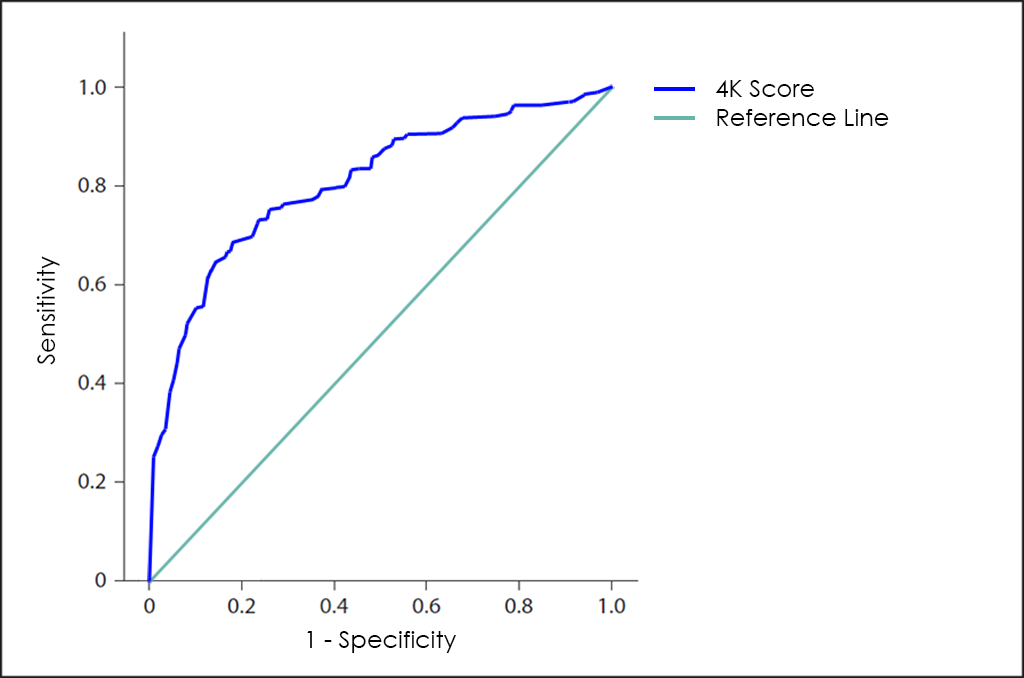
In this way, Opko Health (Nasdaq: OPK), an American biotech company, have developed the 4K Score to also help physicians make the right treatment decisions for patients with enlarged prostate gland or high PSA levels and avoid unnecessary prostate biopsies.
The 4K Score is based in 4 kallikrein found in urine, such as Total PSA, Free PSA (fPSA), Intact PSA (iPSA) and hK2, and the global performance is greater than PSA, but still not significant.
Finally, superposed ROC curves for Total PSA Test, hK2, PCA3 as well as 4K Score, that also include the one for OncoPROSTATE Dx test.
Uses and purposes for OncoPROSTATE Dx
OncoPROSTATE Dx test has been developed for:
- Aid in diagnostic assessments for high-risk patients (men older than 50 years with PSA blood levels higher than 4 ng/mL).
- Confirm or discard malignancy from results obtained previously with other tests, such as Computed Tomography (CT) Scan or Magnetic Resonance Imaging (MRI) findings thanks higher Sensitivity and Specificity than imaging procedures.
- Help doctors predict the cancer’s behaviour and response to treatment, as well as a person’s chance of recovery.
- Guide treatment decisions (such as decide whether to add or immunotherapy after surgery and/or radiation therapy), therapy monitoring (doctors may use changes in the presence or amount of one or more Tumor Markers to assess how the cancer is responding to treatment) and predict or monitor for recurrence (looking for changes in the amount of a Tumor Marker may be part of their follow-up care plan and may help detect a recurrence sooner than other methods).
The Science Behind OncoPROSTATE Dx
Based on Publications
- Salami S. S., Schmidt F., Laxman B., Regan M. M., Rickman D. S., Scherr D., Bueti G., Siddiqui J., Tomlins S. A., Wei J. T., Chinnaiyan A, Rubin M. A., Sanda M. G. “Combining Urinary Detection of TMPRSS2:ERG and PCA3 with Serum PSA to Predict Diagnosis of Prostate Cancer.” Urol Oncol. 2013 July ; 31(5): 566–571. DOI: 10.1016/j.urolonc.2011.04.001
- Molina R., Filella X., Trapé J., Augé J. M., Barco A., Cañizares F., Colomer A., Fernandez A., Gaspar M. J., Martinez-Peinado A., Pérez L., Sánchez M., Escudero J. M. (2013). “Principales causas de falsos positivos en los resultados de marcadores tumorales en suero.” Sociedad Española de Bioquímica Clínica y Patología Molecular. Comisión de Marcadores Biológicos del Cáncer. PDF
Related Publications
- Abrate, A., et al., Clinical performance of the Prostate Health Index (PHI) for the prediction of prostate cancer in obese men: data from the PROMEtheuS project, a multicentre European prospective study. BJU Int, 2015. 115(4): p. 537-45. PDF
- Abrate, A., G. Lughezzani, G. M. Gadda, G. Lista, E. Kinzikeeva, N. Fossati, A. Larcher, P. Dell’Oglio, F. Mistretta, N. Buffi, G. Guazzoni and M. Lazzeri (2014). “Clinical use of [-2]proPSA (p2PSA) and its derivatives (%p2PSA and Prostate Health Index) for the detection of prostate cancer: a review of the literature.” Korean J Urol 55(7): 436-445. DOI: 10.4111/kju.2014.55.7.436
- Alapont JM, Navarro S, Budía A, España F, Morera F, Jiménez JF. PSA y hK2 en el diagnóstico de cáncer de próstata. Servicio de Urología y *Centro de Investigación. Hospital Universitario La Fe. Valencia – ACTAS UROLÓGICAS ESPAÑOLAS JUNIO 2008. PDF
- BARUTÇUOĞLU, B., et al., Performance of total prostate specific antigen and free prostate specific antigen ratio for screening prostate. Turkish Journal of Cancer. 39, 2009. 1. PDF
- Bo M, Ventura M, Marinello R, Capello S, Casetta G, Fabris F. Relationship between Prostatic Specific Antigen (PSA) and volume of the prostate in the Benign Prostatic Hyperplasia in the elderly. Crit Rev Oncol Hematol. 2003;47(3):207-11. PMID: 12962896
- Cook, B. Prostate cancer diagnostics: now and in the future. 2013. Web
- Duffy, M. J. (2010). “Clinical Utility of Tumor Markers: What the Guidelines Recommend.” Journal of Laboratory Diagnostics 46(3): 281-291. PDF
- Duffy, M. J. and P. McGing (2010). Guidelines for the use of tumour markers. PDF
- Fernández J, Olmo JM, Fernández A, Martín JA, Bermúdez FJ, Pulido E, Molero JM, Morales D. Criterios de derivación en hiperplasia benigna de próstata para atención primaria – Actas Urológicas Españolas – 2010. DOI: 10.1016/S0210-4806(10)70007-3
- Filella X, Giménez N. Evaluation of [− 2] proPSA and Prostate Health Index (phi) for the detection of prostate cancer: a systematic review and meta-analysis, Clinical Chemistry and Laboratory Medicine (CCLM) 2012. DOI: 10.1515/cclm-2012-0410
- Filella X, Foj L, Alcover J, Augé JM, Escudero JM, Molina R. ProPSA, un nuevo biomarcador para la detección y el manejo del cáncer de próstata. Revista del Laboratorio Clínico, 2013. DOI: 10.1016/j.labcli.2013.01.006
- Filella X, Foj L. Emerging biomarkers in the detection and prognosis of prostate cancer. Clinical Chemistry and Laboratory Medicine (CCLM) 2014. DOI: 10.1515/cclm-2014-0988
- Haese A, Graefen M, Noldus J, Hammerer P, Huland E, Huland H. Prostatic volume and ratio of free-to-total prostate specific antigen in patients with prostatic cancer or benign prostatic hyperplasia. J Urol. 1997;158(6):2188-92. PMID: 9366341
- Haese, A. and Partin A.W., Total, Complexed, and Free PSA Forms and Human Glandular Kallikrein 2, in Current Clinical Urology: Management of Prostate Cancer, E.A. Klein, Editor., Humana Press Inc. DOI: 10.1007/978-1-59259-776-5_2
- Hwang, I., et al., The diagnostic ability of an additional midline peripheral zone biopsy in transrectal ultrasonography-guided 12-core prostate biopsy to detect midline prostate cancer. Ultrasonography, 2016. 35(1): p. 61-8. DOI: 10.14366/usg.15039
- Jara Rascón, J., et al., Evaluación del antígeno especifico prostático (PSA) ajustado al volumen de la zona transicional en la detección del cáncer de próstata. Actas Urol Esp, 2005. 29(5). Web
- Malik, G., M. D. Ward, S. K. Gupta, M. W. Trosset, W. E. Grizzle, B. L. Adam, J. I. Diaz and O. J. Semmes (2005). “Serum levels of an isoform of apolipoprotein A-II as a potential marker for prostate cancer.” Clin Cancer Res 11(3): 1073-1085. PMID: 15709174
- Martins A, Reis A, Bovo T, Suaid H, Cologna A, Paschoalin E. Free PSA and prostate volume on the diagnosis of prostate carcinoma – Acta Cirurgica Brasileira – 2003. DOI: 10.1590/S0102-86502003001200008
- Mayeux, R. (2004). “Biomarkers: potential uses and limitations.” NeuroRx 1(2): 182-188. DOI: 10.1602/neurorx.1.2.182
- Medicine, T. A. f. c. B. L. (2013). RECOMMENDATIONS AS A RESULT OF THE ACB NATIONAL AUDIT ON TUMOUR MARKER SERVICE PROVISION. PDF
- Molina, R., et al., Utility of serum tumor markers as an aid in the differential diagnosis of patients with clinical suspicion of cancer and in patients with cancer of unknown primary site. Tumour Biol, 2012. 33(2): p. 463-74. DOI: 10.1007/s13277-011-0275-1
- Nam RK, Diamandis EP, Toi A, et al. Serum human glandular kallikrein-2 protease levels predict the presence of prostate cancer among men with elevated prostate-specific antigen. J Clin Oncol. 2000;18(5):1036-42. DOI: 10.1200/JCO.2000.18.5.1036
- Nickel JC. Benign prostatic hyperplasia: does prostate size matter?. Rev Urol. 2003;5 Suppl 4:S12-7. PMCID: PMC1502356
- Novakovic, S. (2004). “Tumor markers in clinical oncology.” Radiology and Oncology 38(2). PDF
- Ontario Prostate Specific Antigen (PSA) Clinical Guidelines: The PSA Clinical Guideline Expert Committee for the Laboratory Proficiency Testing Program (LPTP), 97.09.30, in Physician Reference Document. 1998. PDF
- Perez, E. O. and M. I. Aceituno Azaustre (2014). “Utilidad clínica de los marcadores tumorales.” Revista Médica de JAÉN(4): 2-12. PDF
- Perkins, G. L., E. D. Slater, G. K. Sanders and J. G. Prichard (2003). “Serum Tumor Markers.” American Family Physician 68(6): 1075 – 1082. PDF
- Punnen, S., N. Pavan and D. J. Parekh (2015). “Finding the Wolf in Sheep’s Clothing: The 4Kscore Is a Novel Blood Test That Can Accurately Identify the Risk of Aggressive Prostate Cancer.” Rev Urol 17(1): 3-13. PMCID: PMC4444768
- Saedi, M. S., Z. Zhu, K. Marker, R. S. Liu, P. M. Carpenter, H. Rittenhouse and S. D. Mikolajczyk (2001). “Human kallikrein 2 (hK2), but not prostate-specific antigen (PSA), rapidly complexes with protease inhibitor 6 (PI-6) released from prostate carcinoma cells.” Int J Cancer 94(4): 558-563. PMID: 11745444
- Salagierski M, Mulders P, Schalken JA. Predicting prostate biopsy outcome using a PCA3-based nomogram in a Polish cohort. Anticancer Res. 2013;33(2):553-7. PMID: 23393348
- Sharma, S. (2009). “Tumor markers in clinical practice: General principles and guidelines.” Indian J Med Paediatr Oncol 30(1): 1-8. PMCID: PMC2902207
- Sikaris, K. PROSTATE HEALTH INDEX. The latest advance in prostate health testing. 2012. DOI: 10.1177/1756287213513488
- Stephan, C., et al., The ratio of prostate-specific antigen (PSA) to prostate volume (PSA density) as a parameter to improve the detection of prostate carcinoma in PSA values in the range of < 4 ng/mL. Cancer, 2005. 104(5): p. 993-1003. DOI: 10.1002/cncr.21267
- Stephan C, Stroebel G, Heinau M, et al. The ratio of prostate-specific antigen (PSA) to prostate volume (PSA density) as a parameter to improve the detection of prostate carcinoma in PSA values in the range of < 4 ng/mL. Cancer. 2005;104(5):993-1003. DOI: 10.1002/cncr.21267
- Sturgeon, C. (2002). “Practice guidelines for tumor marker use in the clinic.” Clin Chem 48(8): 1151-1159. PMID: 12142367
- Sturgeon, C. M., E. P. Diamandis, B. R. Hoffman, D. W. Chan, S. L. Ch’ng, E. Hammond, D. F. Hayes, L. A. Liotta, E. F. Petricoin, M. Schmitt, O. J. Semmes, G. Söletormos and E. van der Merwe (2009). National Academy of Clinical Biochemistry Laboratory Medicine Practice Guidelines for use of tumor markers in clinical practice: quality requirements. DOI: 10.1373/clinchem.2007.094144
- Sturgeon, C. M., B. R. Hoffman, D. W. Chan, S. L. Ch’ng, E. Hammond, D. F. Hayes, L. A. Liotta, E. F. Petricoin, M. Schmitt, O. J. Semmes, G. Soletormos, E. van der Merwe, E. P. Diamandis and B. National Academy of Clinical (2008). “National Academy of Clinical Biochemistry Laboratory Medicine Practice Guidelines for use of tumor markers in clinical practice: quality requirements.” Clin Chem 54(8): e1-e10. DOI: 10.1373/clinchem.2007.094144
- Trapé Pujol, J. and R. Molina Porto (2006). “Aspectos generales de los marcadores tumorales.” JANO 1620: 45-48. PDF
- Zhu, Y., et al., Development and external validation of a prostate health index-based nomogram for predicting prostate cancer. Sci Rep, 2015. 5: p. 15341. DOI: 10.1038/srep15341